Viaquant

Predictive modeling and pattern recognition across crypto, equities, and more.

BTC75,630−0.26%ETH2,078+0.32%Total Crypto$2.62T−0.79%GOLD4,523.10−0.26%DXY99.08−0.08%VIX16.98−0.18%NVDA214.86−0.22%SOL83.68+0.11%SPX7,519.12+0.61%QQQ730.28+1.78%
About
Ryan Bolks
Ryan Bolks · Founder

Meet the Mind Behind the Models

Ryan Bolks is the creator of Viaquant, a quantitative research practice focused on predictive modeling across the world's largest asset classes. Over seven years, he has developed systematic, model-driven strategies that translate market structure and macro signals into verifiable, timestamped forecasts. His methodology is grounded in mathematical rigor and pattern recognition, applying probabilistic frameworks to identify high-probability market behavior before it unfolds. Every analysis published under the Viaquant name is held to the same standard as institutional research, designed to help investors and traders develop a deeper, more structured understanding of markets and price behavior.

In 2022, Bolks began publishing his work on TradingView, the largest and most popular investing community, social network, and charting platform in the world, with over 100 million users. What makes TradingView uniquely suited to this approach is its immutability: once an idea is published, it cannot be edited, deleted, or altered in any form. Every forecast stands permanently on the record, exactly as it was written. That is the standard Viaquant operates by, and why every idea published means something. To learn more about Ryan, follow his socials or connect with him directly.

870
Published ideas
1,038
TV followers
500+
Verified predictions
7+ years
Market research

Where to follow

Market Analysis

Most Recent Ideas & Predictions

ETH - LTF Upside Reversal Signal
SOL·4H

ETH - LTF Upside Reversal Signal

Quick update: both ETH and SOL have just printed reversal signals on the lower timeframe. On the 4H, both have printed reversal dojis above their LTF candle body support levels (green line). In addition to that, the current candle has tested that level and started to make a move back to the upside. The RSI is also attempting to start an uptrend from oversold conditions, which could give buyers the fuel for some sort of relief rally across the board. For ETH the target would be somewhere between $2,230 and $2,260, and for SOL a move back around $89 to $90. The main signal that this upside move has come to an end would be BTC seeing strong selling between $78,000 and $79,500. If price gets that high and sellers start coming in aggressively then the lows will be retested. One important thing to keep in mind. If the current lows are broken and the RSI drops back below oversold conditions then the macro bearish setup is still in play and the relief rally will not occur until lower targets are visited first.

by VIAQUANT
1w ago
1 3
TSLA - Selloff This Week
TSLA·1W

TSLA - Selloff This Week

Tesla closed Friday's weekly candle as a gravestone doji. For those unfamiliar, a gravestone doji is a bearish reversal candlestick pattern that signals a potential upcoming downtrend. It forms when buyers push price higher during a session but sellers aggressively drive it back down, causing price to close at or near its opening value. I have outlined four recent instances where either a regular doji marked a local high/top, as well as the two most recent examples of a gravestone doji specifically. The last gravestone doji printed on May 27, 2025, after which price saw a 23% drop over the following week from a high of $355 to a low of $273. It is also worth noting that TSLA has been trading within a massive rising wedge, and the top was formed right around the key psychological $500 level. I have this rising wedge outlined on the weekly timeframe with solid black trendlines, but it is also important to examine this pattern on the monthly timeframe as that appears to be where candle body closes matter most for this particular structure:

by VIAQUANT
1w ago
2 6
BTC - Important S/R Zones
BTC·12H

BTC - Important S/R Zones

This is an updated look at my last idea: In this chart I have all the important support and resistance zones highlighted. The red boxes represent major resistance or selling areas and the green boxes represent major support or buying levels. Price recently broke down from a previous support zone which has now flipped into new resistance. Therefore, if price bounces from the current green box, watch that upper red box as the area where sellers will begin to offload again. Alternatively, if price is unable to hold the current green box and flips it into new resistance, the next destination would be the $70,000 to $72,000 level highlighted as the "Main Support." Another thing worth noting are the two solid white lines representing the rising wedge or bear flag that price has been trading within throughout this entire move up. Now that price is back inside the pattern, BTC should expect a move at some point back to the lower white trendline of support. What makes this particularly interesting is that this is the second pattern of this type where BTC saw an upside deviation before reclaiming back within the pattern and completing the downside move:

by VIAQUANT
1w ago
0 1
The Hall of Fame
BTC- Could The Bottom Be In?
BTC·1D

BTC- Could The Bottom Be In?

We have been waiting for a black swan event to help us reach our Q4 bottom (based on range date trend) and thanks to FTX we got it today. Therefore, did this lower low mark our 2022 bottom? In this chart you can see we have had a very key trendline (black dotted line). Every time we have rallied up to it, we have seen a rejection (red arrows) until we finally broke above (breakout). Since the breakout, we fell in prices to retest our old resistance as new support (successful retest #1) and confirmed it by rallying 15% off of that trendline. Then, we created a lower high in price around $21,500 and have had this collapse to the downside. What is interesting is our wick ($16,800) tapped our trendline exactly again confirming it as new support (successful retest #2) and have already had around a 10% bounce off the low. This could indicate the bottom is in as long as we continue to close daily candle bodies inside or above our key support zone (green box). Of course this could be the straw that broke the camels back and we go much much lower to the prices I have indicated in the past (check "My Black Swan Theory" analysis for these levels). Right now I am very bullish as this looks exactly like what happened in our bear market of 2015. On top of that, the Pi cycle bottom has already flashed, Based on the date range trend we should see a bottom in Q4 2022 (which this could be it), and many other indicators that say the bottom is in. I am happy to change my analysis is we start closing key candle bodies below our key support, but for now I'm sticking to my thesis that the bottom was just put in.

by VIAQUANT
Nov 9, 2022
5 9
BTC- Bottom most likely in based on TOTAL
TOTAL·1W

BTC- Bottom most likely in based on TOTAL

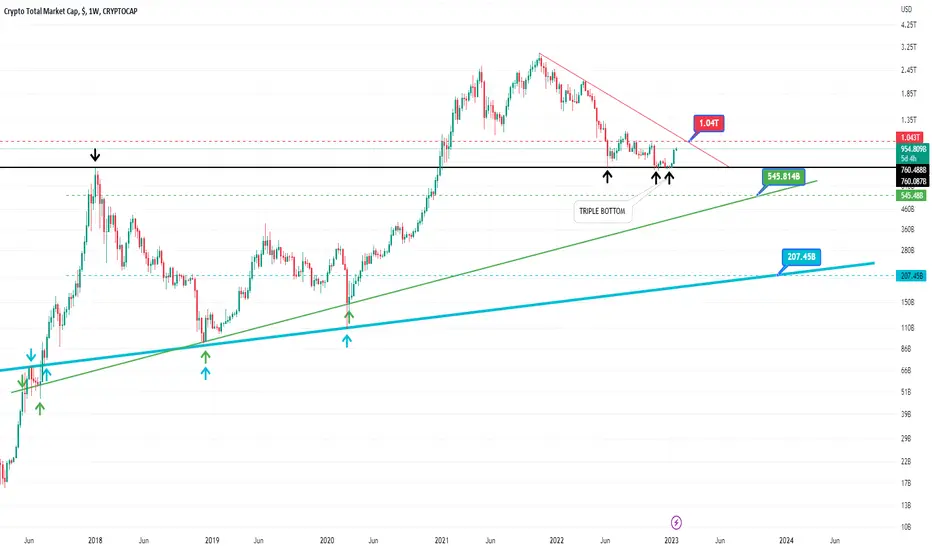
Please refer to my previous post "Total Cryptocap" to see my prediction of the crypto markets losing 200B+ to hit the $760B level again. Here is one of the most important charts for all of crypto. This includes every cryptocurrency across the board. From my previous post we were looking for a retest of the $760B level then if we had a weekly confirmation close below we would look for the $300-400B levels. So far, this has played out like clockwork. Marketcap got rejected at the key $1.04 T level (FTX collapse) and sent us back to the same $760B level. What is very interesting now is what happened at the retest of $760B. Instead of closing a weekly candle below, we held every candle as support and have now made a momentous rally back to $950B! This is amazing because it could have cemented the bottom based on marketcap. There are many reasons why 760B is so important. 760B was our 2017 all time high for the cryptocurrency markets. Back in June 2022 when we fell to $17.5k we hit 760B before having an explosive rally back to over $1T. This marked our first case scenario of macro old resistance (2017) flipping into macro new support (2022). Then again, after the FTX collapse we revisited that $760 B market cap and di not just double bottom but triple bottomed (black arrows)!!! This gives us strong hope that the bottom is in ajnd if we can get above our resistance (red trendline) we could start a new bull market. Now lets just theorize what we should look for if we get a weekly candle close below 760b. If marketcap gets rejected at our red trendline and previous top (around the psychological 1T/1.04t Level) then we could see another leg down. If marketcap breaks the key 760B level then we would look for our next level of support which is our green trendline. This green trendline has been holding candle body support since 2016. I estimate this level could be around 545B based on historic confluence (greed dotted ray). If marketcap can't hold the green trendline then we would look for our macro blue trendline since 2016. This trendline (depending on when marketcap would hit it) would put us around $200B. I have also added a blue dotted ray to outline that historic level. What do you guys think? Is this enough confirmation that the bottom is truly in or do we have lower to go?

by VIAQUANT
Jan 17, 2023
0 4
BTC - The Golden Goose of Charts
BTC·1W

BTC - The Golden Goose of Charts

This cycle has started to differ from normal 4 year cycle theory. Therefore, TA might not be as important as institutions siphoning up the BTC Supply. But if normal TA is to play out from the current point in this market cycle this is what we could expect for price to do. The timeframe is hard to dictate, if this scenario will happen before or after the halving, but right now it looks as if BTC could be forming a massive Cup & Handle pattern. Of course, if the ATH is broken soon then this scenario will most likely be invalidated. If this is the case, price should see an initial pullback to our 0.786 which is located at $57.4k. Also, the RSI is reaching our red zone of overextension so some kind of substantial pullback would not be out of the ordinary. Then, If we are gracious enough to retrace all the way back to the 0.618 (to flip old resistance into new support) the $48-50k would be the final buying opportunity before the ATH is broken in my opinion. I would also look to front run this level as that is what institutions will be doing, so once you see a major wick close to that level it will likely be the low if in fact we do get close to those levels. A couple other gold nuggets we have included in this chart. The 1.618 around $102k will be a very important level this cycle. Makes sense as well with $100k being very psychological. Also based on Viaquant's quantitative data. Somewhere around the $83.8k level will become very important. It is a secret level that will become clear in the future, but want to present this data to the market way in advance to prove how extraordinary Viaquant is from any other fund/institution.

by VIAQUANT
Mar 7, 2024
1 4
Articles

Research & Writing

Contact

Let's talk

For general inquiries, proposals, or opportunities, send a message here. For informal requests, DM me on X.